


DevOpsSmartBoard which helps to generate key metrics at the Azure DevOps organization level and also at the team project level giving users the freedom to access various types of reports based on different needs either role based or SDLC stage. All the reports are available in a single platform and are easy to access at one click.
285
What is DevOpSmartBoard: DevOpSmartBoard (DSB) is the Ultimate End-To-End and One Stop Dashboard solution for all the Azure DevOps reporting needs at organization and project level.
239
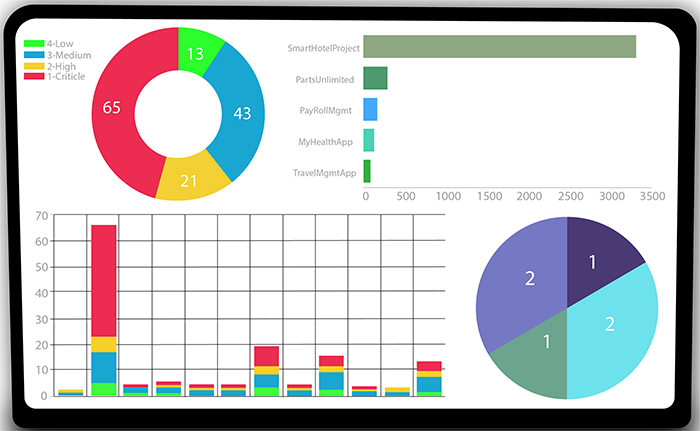
This view provides metrics about the Azure DevOps Organization. The tiles display total number of users, count of projects, work items, repos, Pull-Requests, Build & ReleasePipeline etc. The charts display Bug trend, project wise count of work items,PR, build and release pipelines.
197

For large applications, tracking build and release details can be challenging. That's where DevOpSmartBoard comes in, providing a comprehensive view of the build and release pipeline.
171

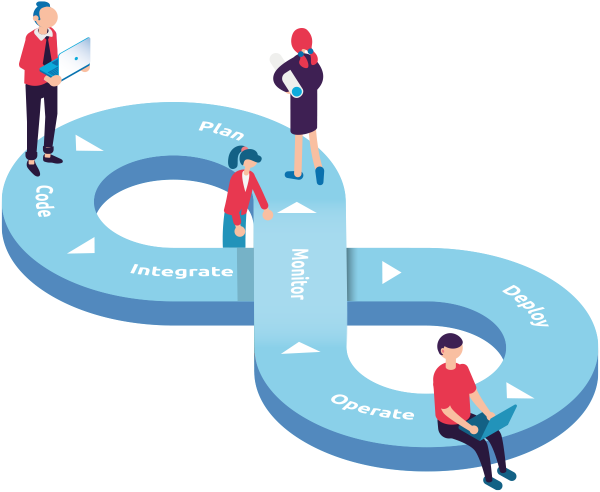
DevOps words means many things to many people and all the definitions might be partly right.DevOps is all about continuously seeking feedback, understanding challenges, and improving the way the software is development, deployed and consumed by end-user.
163
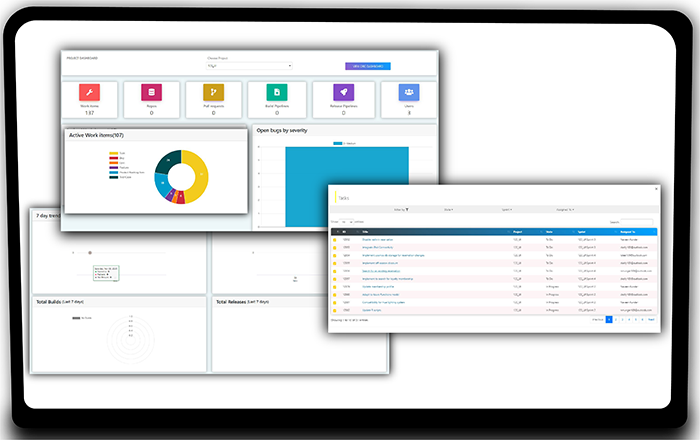
Important metrics of the Team Project like count of work items, repos, pipelines trend etc are provided in this report page. the Tiles display total count of work items, Azure Repos, Pull-Requests, Build & Release Pipeline, and total number of users in the project. The charts display active Work items by type, open bugs by severity, trend of Build and Release executions and outcome
159
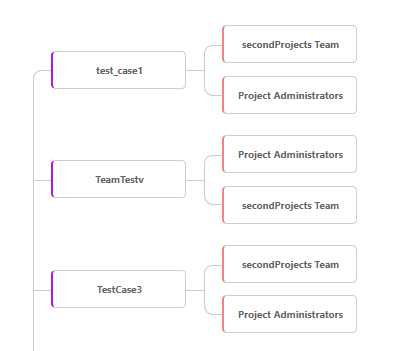
This report provides Userlist details across projects that is at the organization level in charts.
154
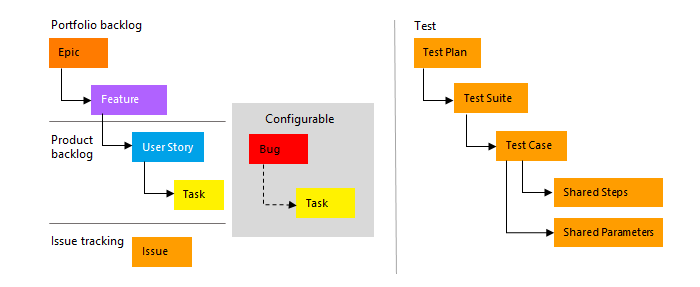
Is the ability to track the relationship between different work items in a project. This can be done by creating a traceability report, which is a comprehensive table that shows the hierarchical relationship between parent work items and their corresponding child work items.
150
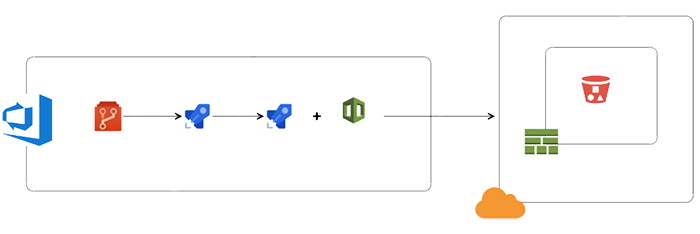
Deployment in DevOps world is key word. The speed and frequency of deployment matters a lot. The more frequent deployments to consumer translates’ to the enhanced feedback cycle.
140

DevOps practices decreases the risk in deploying software changes to production environments. Post deployment to production, there is a risk that the change will break and lead to expensive issues.
123
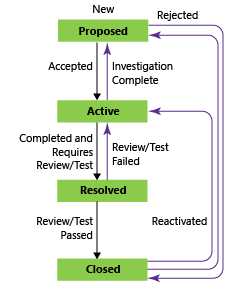
This report provides Process template details across projects that is at the organization level.
120
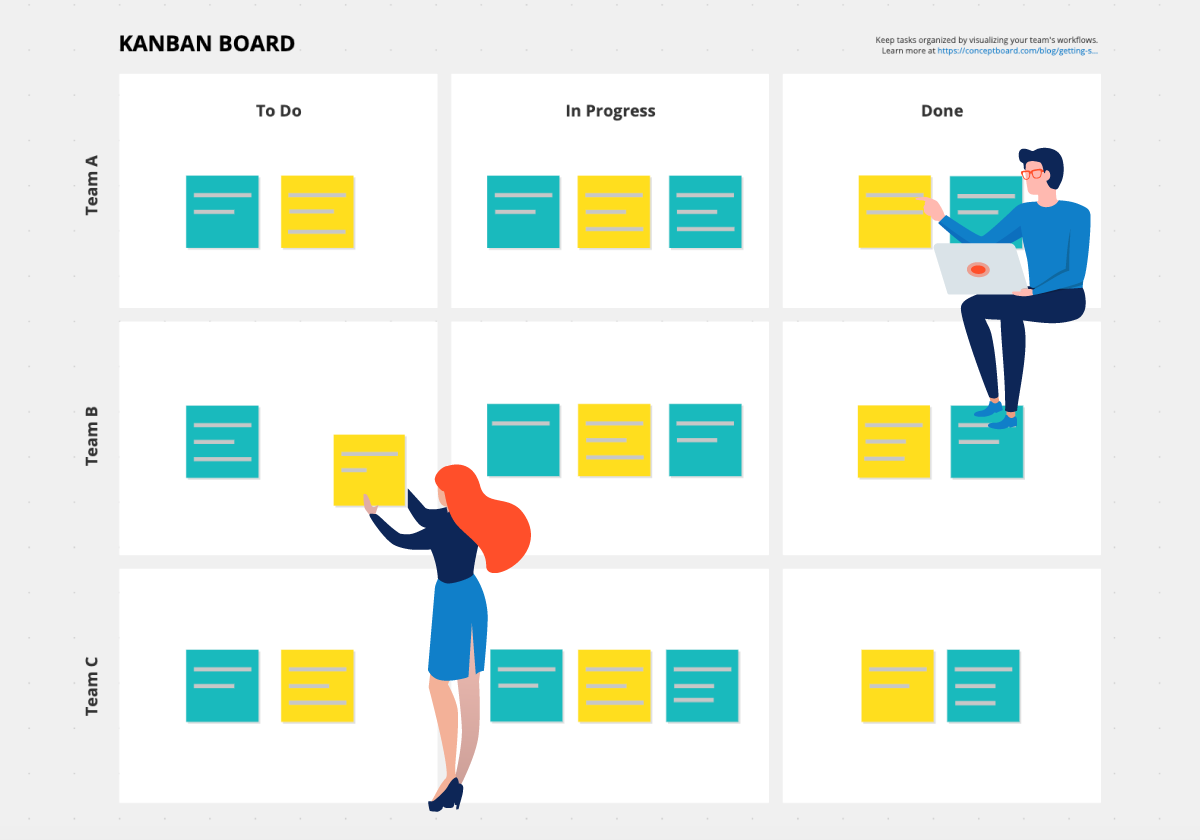
This report will provide the work items across the selected project with filter based on multiple criteria.
119
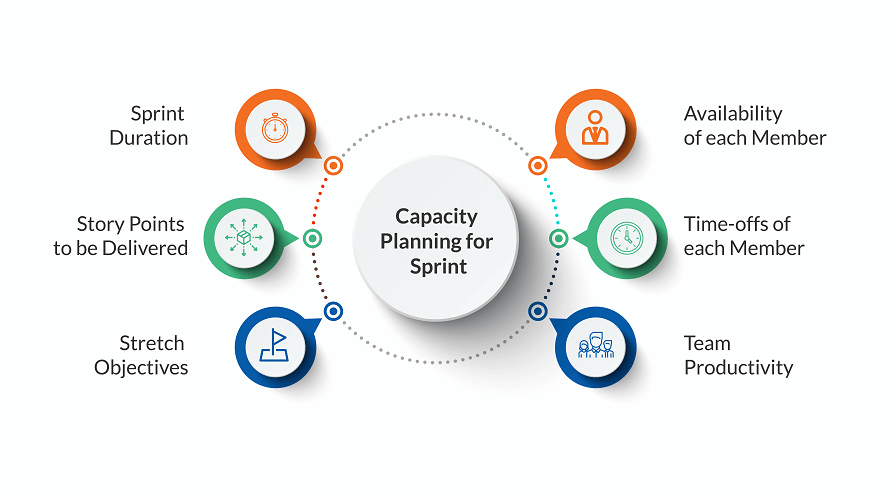
User Capacity Reports offer teams insights into resource allocation, workload distribution, and capacity utilization. By leveraging this data, teams can optimize resource allocation, balance workloads, and improve overall performance.
117

The Pull Request Report is a summary of code merge requests in our repositories. It includes project and repository names, creators, and reviewers. It helps track changes and ensures code quality for better teamwork.
106
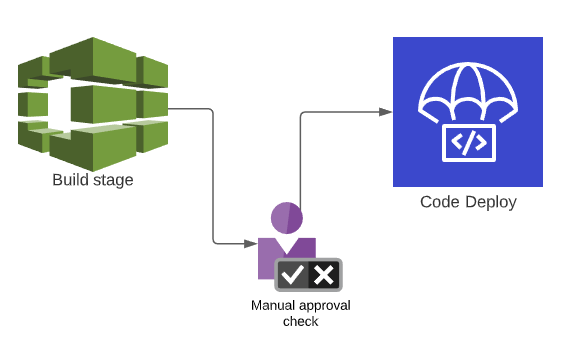
Report provides approver details at each deployment stages across projects that is at the organization level, with options to filter based on release definitions.
103
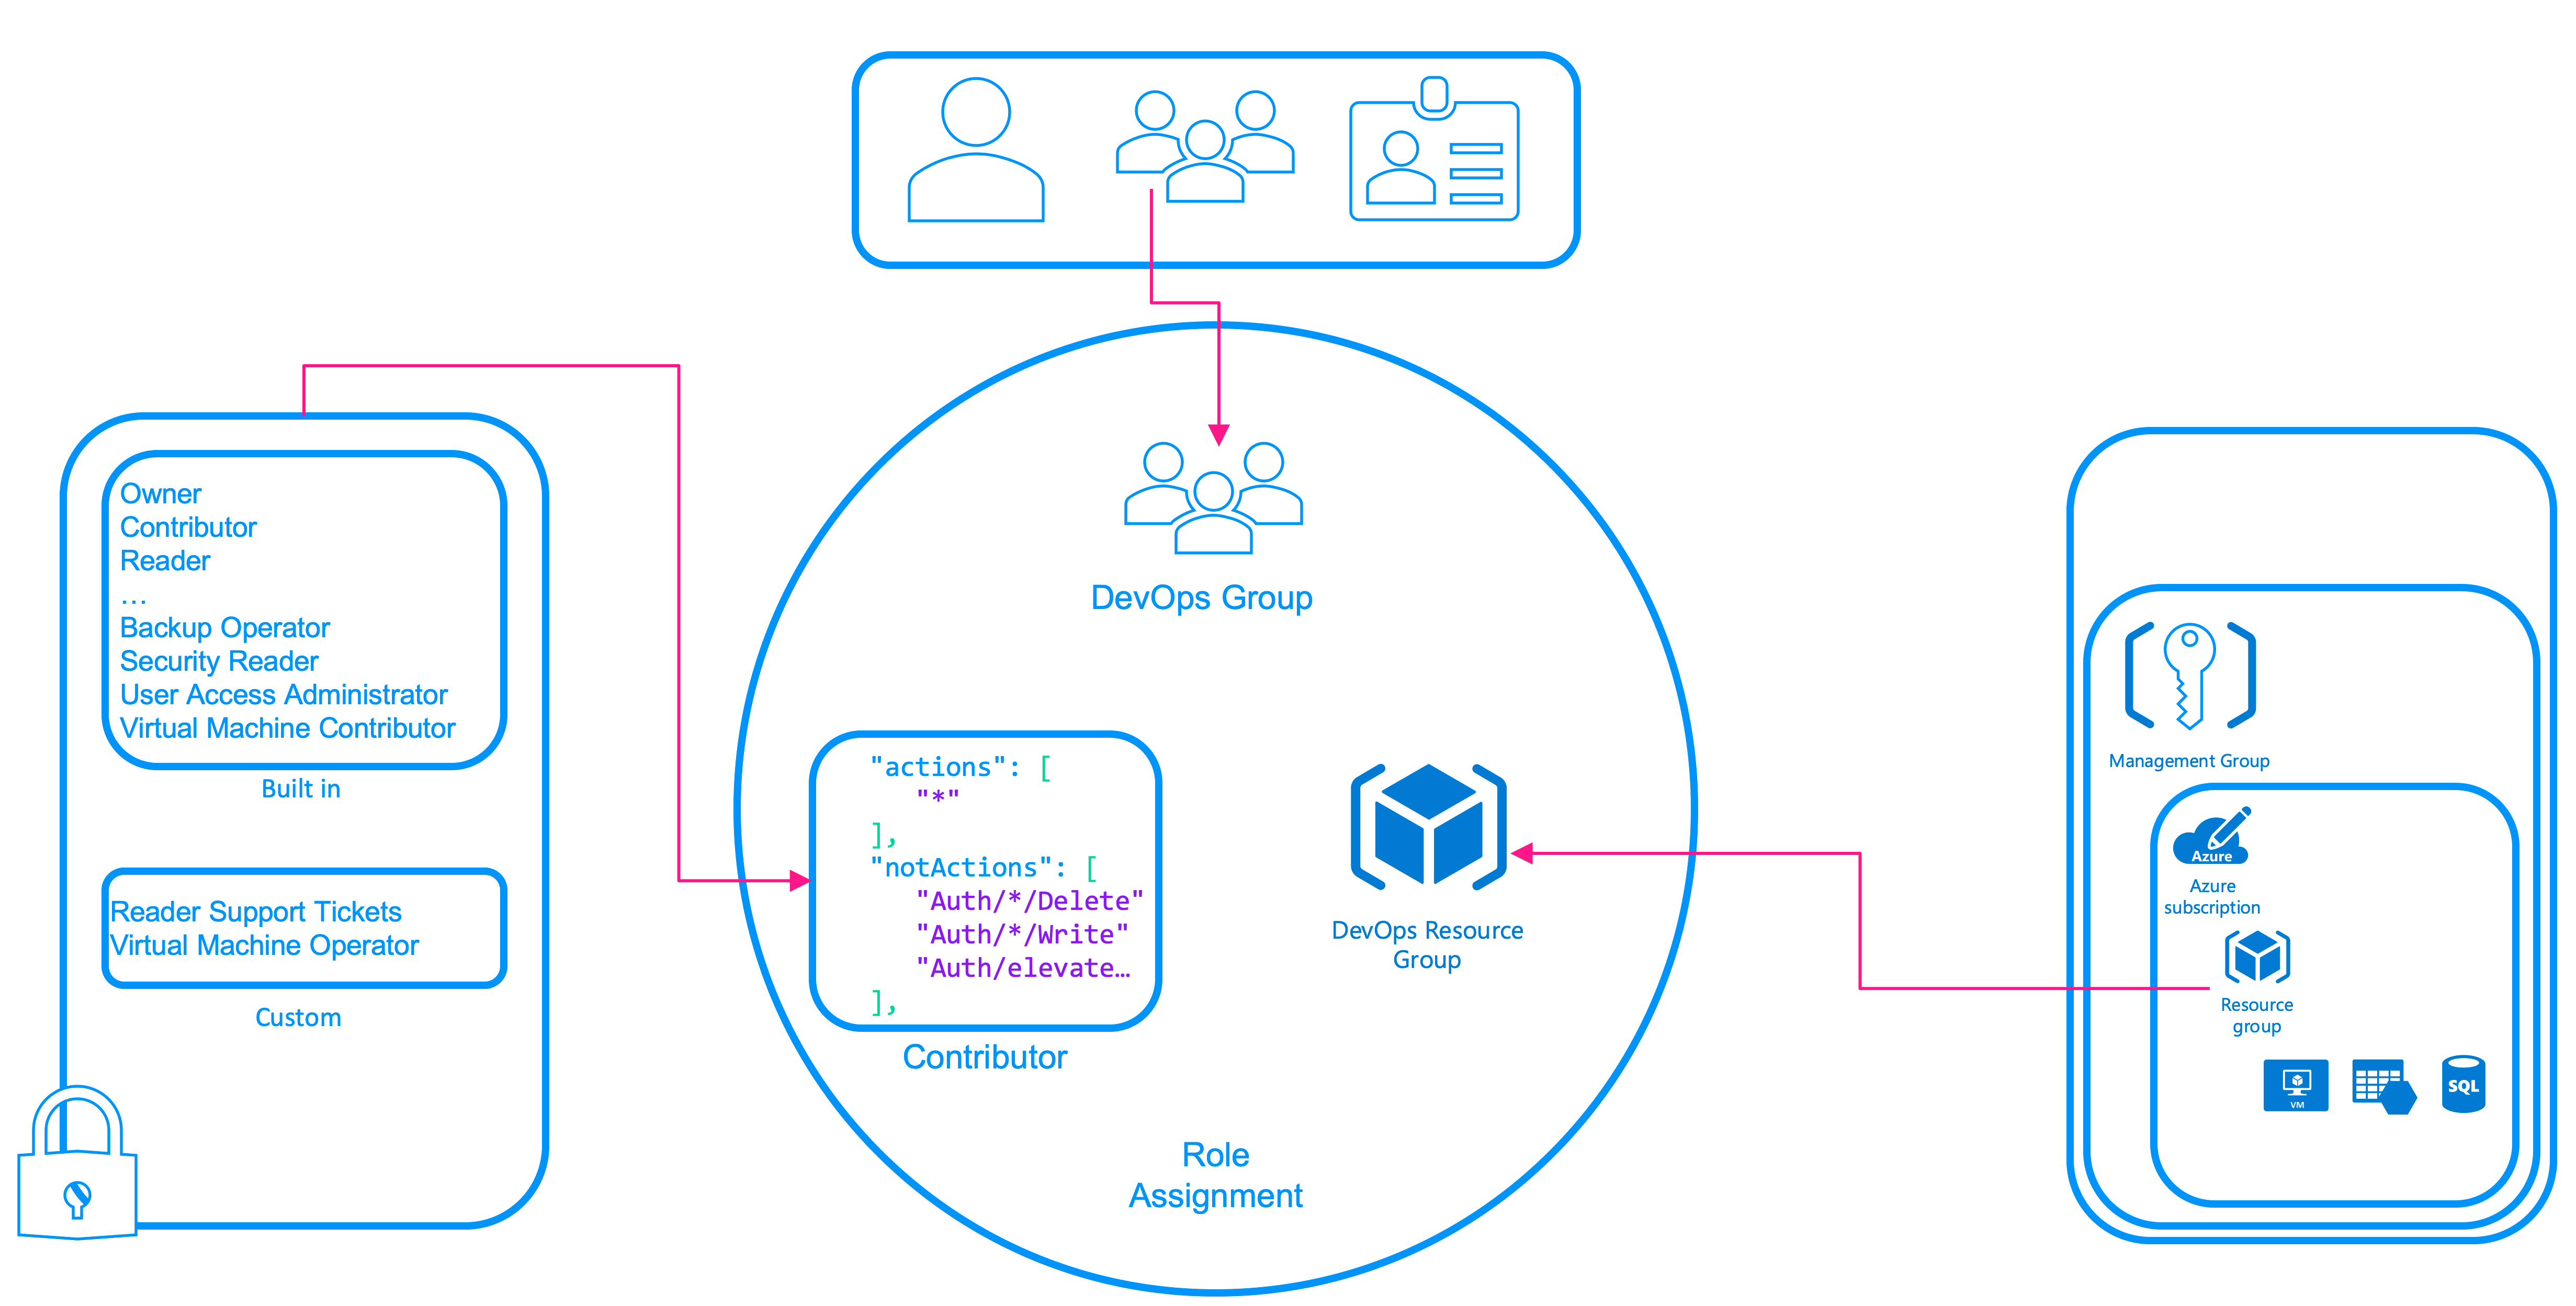
The Group Users Report provides a clear overview of groups within the selected project.
103

This report provides work item query option across projects with many choices to filter the data
100
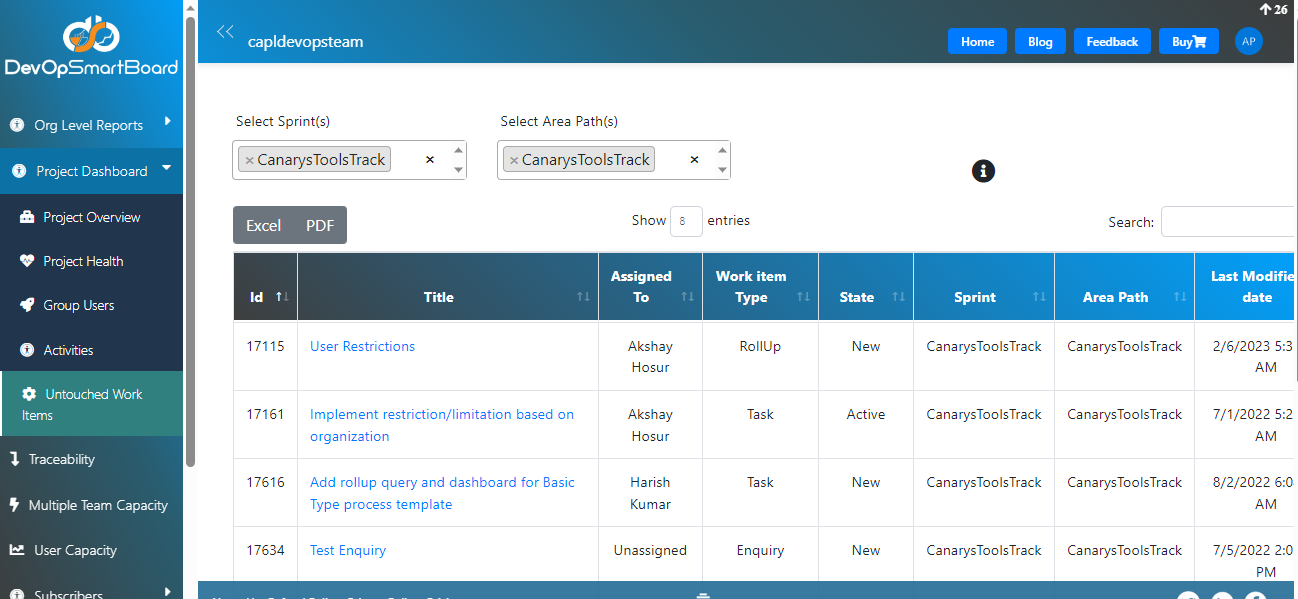
The untouched work items report is a valuable report for project managers who want to ensure that their projects are running smoothly. By identifying and tracking untouched work items, project managers can stay ahead of potential problems and ensure that their projects are completed on time and within budget.
99
The Report will provide a clear and quick visual representation of key work items such as Assigned Work Items, Created Work Item, Created Pull Requests, Reviewed Pull Requests, Commits, Triggered Builds, Triggered Releases, and Pending Approvals.
92

report provides Branch Policy details across projects that is at the organization level.
89
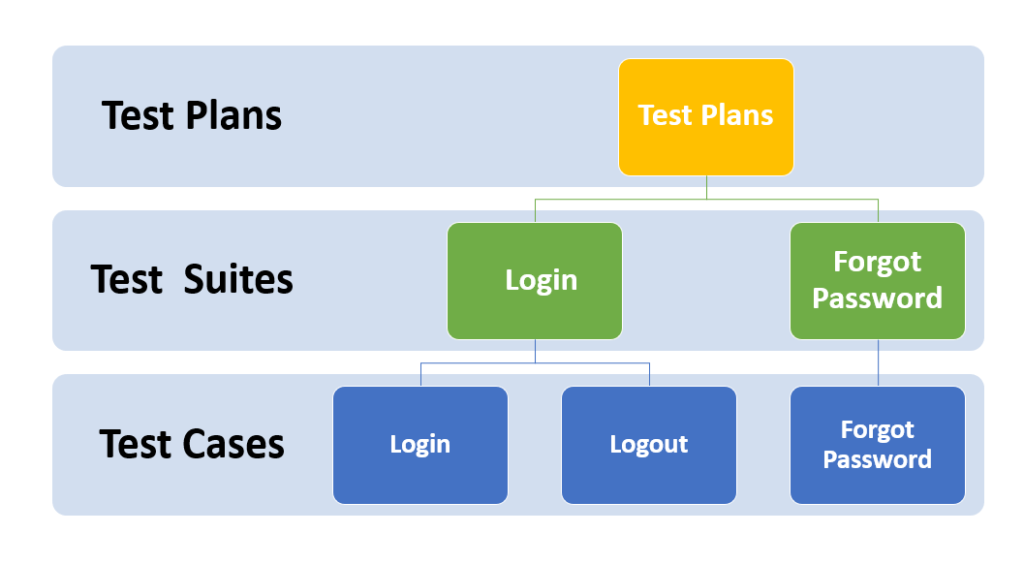
DevOpsSmartboard provide a solution that offers a comprehensive view of the testing process. These tools allow organizations to generate test result reports that provide a clear and detailed overview of the testing activity.
86
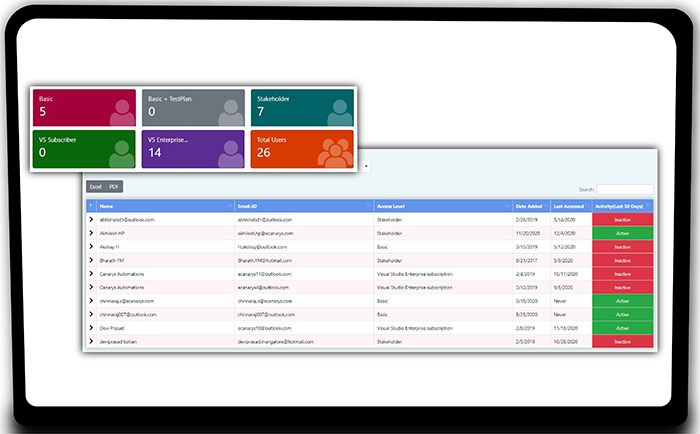
This report basically provides the user details of the DevOps organization, list of users and access to the projects in the organization and based on the activity for last 30 days. It helps them to study the active/inactive status of user and save on license cost by revoking the license for non-active members
84

DevOps and digital transformations have brought an extraordinary increase in the pace and volume of daily change in both development and IT operations. For both IT and development team managing the capacity of multiple teams is difficult and specially when resources are working on multiple teams or playing different roles.
73